News
Louis Dor
Feb 25, 2016

Picture: nodegoat/LAB1100
...that we know of.
Pim van Bree and Geert Kessels are founders of LAB1100 a research and development firm based in The Hague, in the Netherlands.
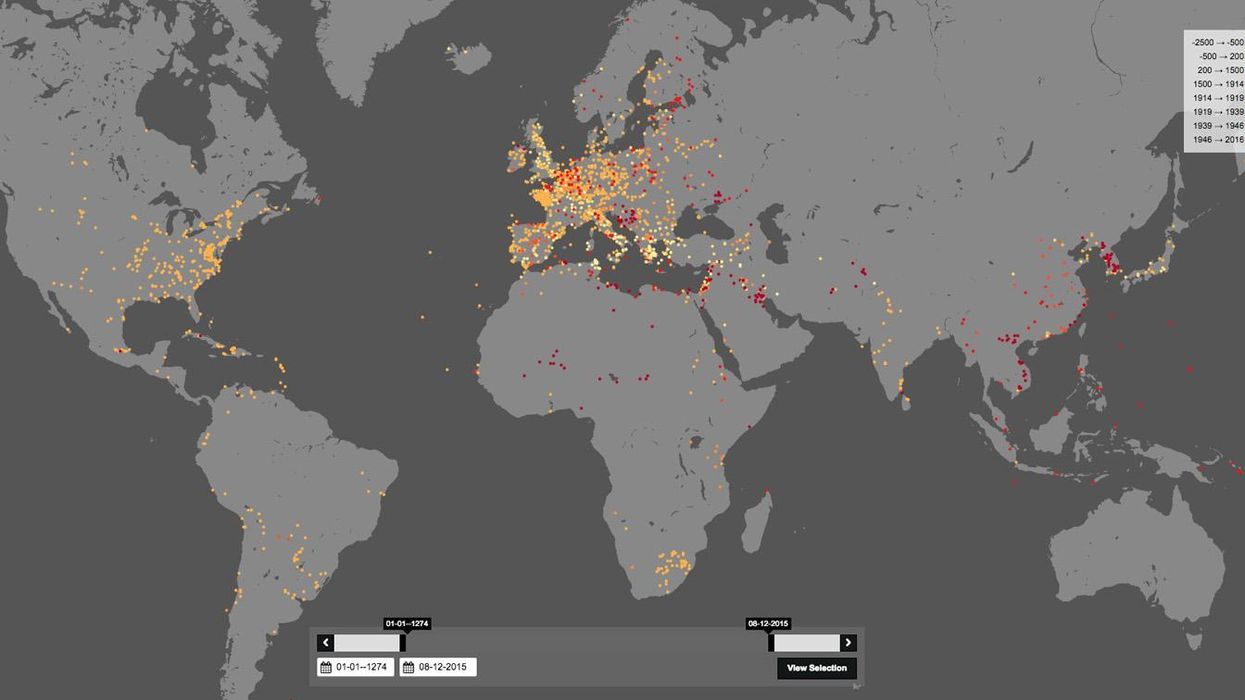
They produced the below visualisation of all the logged locations and dates of conflicts dating back thousands of years, by using data harvested by DBpedia as well as data entered into Wikidata, which reflected entries related to battles in Wikipedia.
It is also available on their website:
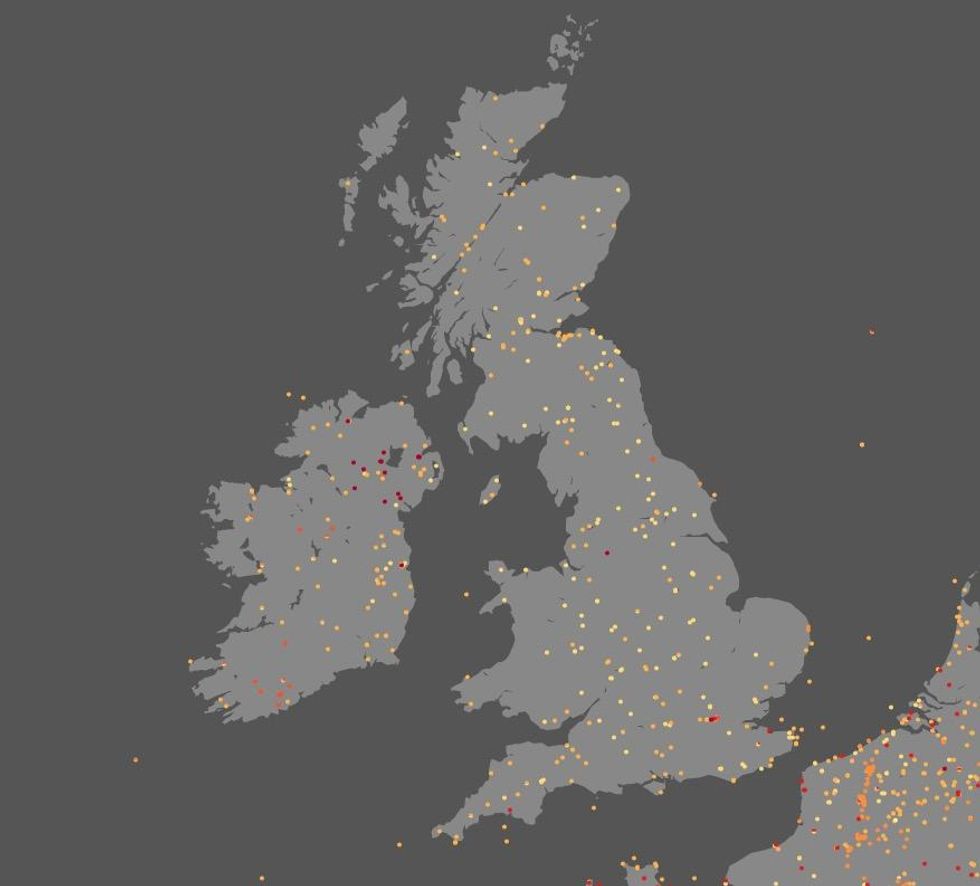
Here's a close-up of the UK:
Van Bree and Kessels told indy100:
We noticed the wealth of structured data that is currently available through Wikidata and DBpedia and wanted to use this data to create a captivating visualisation using nodegoat.
What we found interesting in the resulting visualisation is the western and Eurocentric overrepresentation in this dataset. Obviously, this is a result of the way this dataset has been created, both technically as well as in written history.
You can see the obvious impact of the First and Second World Wars by the sudden appearance of hundreds of datapoints at the start of the 20th century.
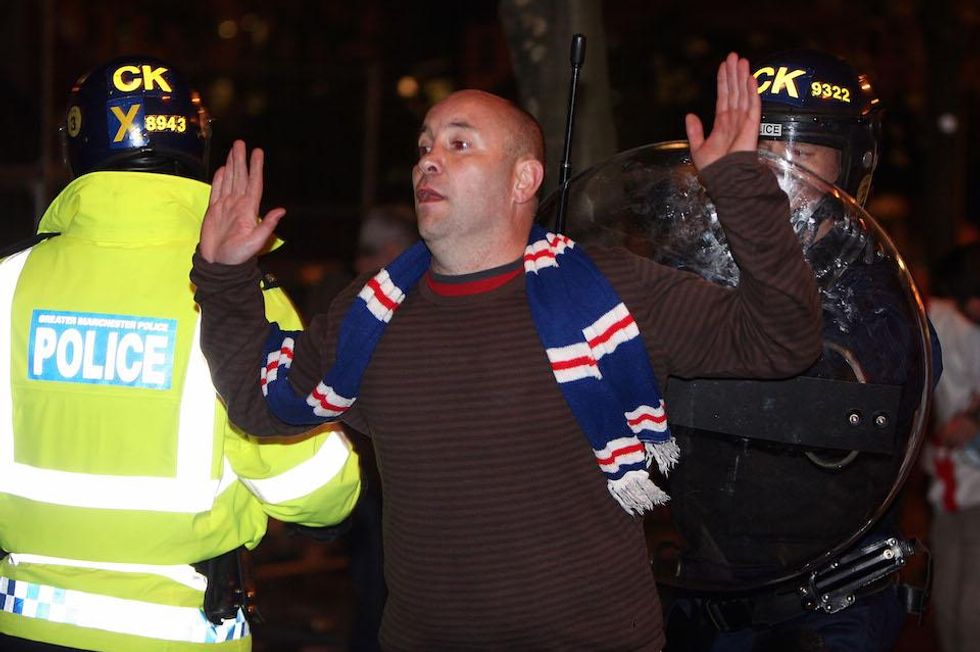
Van Bree and Kessels told indy100 that some of the data was based on automation processes, which led to anomalies:
Under the current state of what would be defined as a battle, the 2008 UEFA Cup Final riots in Manchester have been defined as 'military conflict'.
More:A literary history of the English language in one map
More:This map shows the history of the Milky Way, it's glorious and shows us how our galaxy formed
More:This great map lets you explore the history of migration for every single country
Top 100
The Conversation (0)


