Science & Tech
Louis Dor
Nov 25, 2015

(Picture: GDELT Project/Carto DB
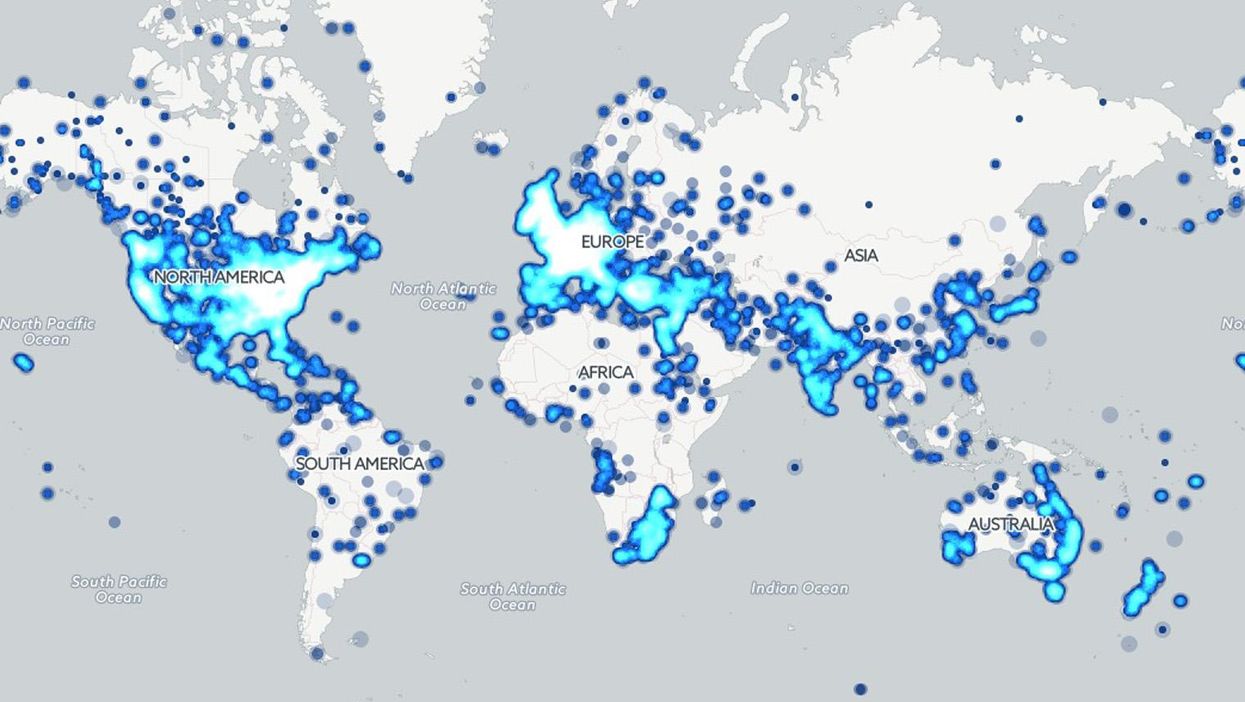
Here's an animated map of recent literary history as read through 3.5 million English language books, since 1800.
If you, as we were, are wondering "How on earth was this made?", we'll tell you.
In 2013, Kalev Leetaru approached the Internet Archive, asking them if he could extract every image and mention of a location from the 600 million pages featured in their digitised book collection.
He did so alongside the basic metadata about the books, as well as nearby images - which now form an archive on Flickr, (currently) over 50,000 pages deep and growing.
In September, Kalev’s GDELT project used 160 processors and a terabyte of RAM from Google Cloud to process the more than 3.5 million English language books since 1800, for various pieces of information.
Kalev then created the map, which marks a dot for all locations mentioned at least 30 times in a given year.
As Kalev points out in his Forbes article on the project, the locations mentioned shed a light on the rate of cultural expansion of the United States, as well as the spread of imperialism.
Around the 1920s you can see copyright limitations start to take place, accounting for the sudden reduction in the frequency of locations.
Between 1855 and 1875, another one of Leetaru's brilliant maps shows the locations mentioned in conjunction with the American Civil War.
Kalev Leetaru's GDELT project is a non-profit initiative supported by Google Ideas.
More:A map of Europe based on where people live in flats or houses
Top 100
The Conversation (0)


